Docker Compose Reference
DetectMate Service ships a comprehensive Docker Compose configuration that includes all services required to consume and process logs and send alerts. This reference explains the settings of the docker-compose.yaml. The following image illustrates the log data pipeline deployed by Docker Compose:
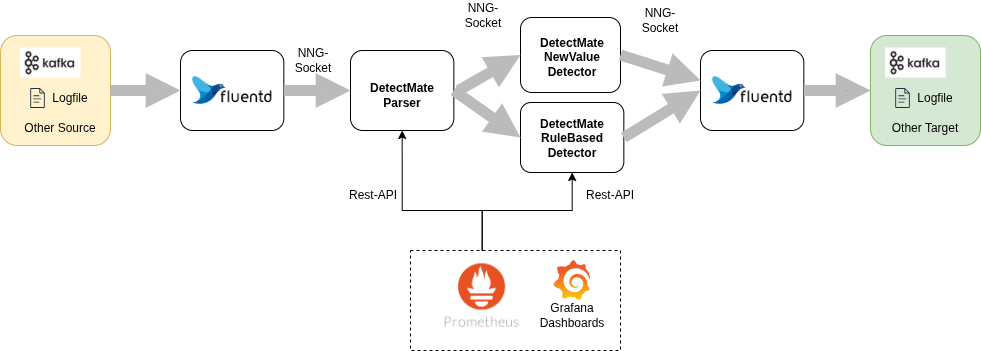
Log file ingestion is handled by Fluentd. It supports reading from various systems and can convert the data to a specific format before sending it to any other target. Using the default setup, fluentd reads lines from a file and sends them to the DetectMate parser. The parser processes the data and forwards it to both detector services shipped by default, detector and detector-rule. If either detector finds an anomaly, it sends it to the fluentout process, which can communicate with various targets, such as Elasticsearch, Kafka, or a log file.
The following sections will explain the docker-compose.yml service by service.
Fluentin
The first component in this configuration is the service fluentin, which is a fluentd container. It reads data from a file, formats it to the proper detectmate protobuf format, and then forwards it via a nanomsg queue socket to the parser service.
While reading from a file is just an example in this setup, you can refer to the Fluentd documentation for guidance on reading from other sources.
Building the image
Docker Compose builds the fluentin image using the configuration in the file container/Dockerfile_fluentd. This Dockerfile uses the official Fluentd image for the base and adds the necessary Fluentd plugins.
Volumes
fluentin mounts the following volumes using bind-mount.
-
container/fluentin:/fluentd/etcprovides the fluentd configuration. The file container/fluentin/fluent.conf can be used to reconfigure fluentd to read from other log sources. -
container/fluentlogs:/fluentd/logexposes the directory containing logfiles to read.fluentinreads all logs from the filesome.logby default. -
container/run:/runis mounted to hold the socket files for inter process communication. In this configuration,fluentinandparserare communicating via unix domain sockets using NNG (Nano Message Next Generation) for maximum performance.
Depends
This services depends on the parser service, because parser creates the socket file to establish communication.
Parser
The second component of the logdata analysis pipeline is the service parser. This DetectMate service listens for logs received from the fluentin service on a Nano Message socket. It expects the data in the LogSchema format used by DetectMate and sends the parsed data using the ParserSchema to another Nano Message socket provided by a DetectMate detector service.
Building the image
Docker compose builds the detectmate image using the Dockerfile in the root of the DetectMate repository. This image is the same for parser and detector.
Volumes
All DetectMate containers (parser, detector and detector-rule) need the following volumes mounted:
-
container/config:/configprovides the DetectMate configuration. Each DetectMate Service needs one settings-file for the general service configuration and one config file for the specific DetectMate component. For parser these files areparser_settings.yamlfor service settings andparser_config.yamlthat holds the component-specific parameters. -
container/logs:/logsexposes all log files that are generated by DetectMate services. Mostly needed for debugging. -
container/run:/runis mounted to hold the socket files for inter process communication.fluentinandparsercommunicate via the fileipc:///run/parser.engine.ipc.parserfans the parsed data out to both detectors:parseranddetectorcommunicate via the fileipc:///run/detector.ipc, andparseranddetector-rulecommunicate viaipc:///run/detector-rule.ipc(seeout_addrinparser_settings.yaml).
Ports
The parser service exposes port 8001 (internally the service runs on port 8000). The management API server runs on this port. This service exposes metrics for the prometheus service and allows to start, stop and reconfigure the service.
Depends
This service depends on the detector and detector-rule services, because they create the socket files to establish communication.
Detector
The detector service listens for parsed logs received from the parser service on a Nano Message socket. It expects the data in the ParserSchema format used by DetectMate and sends anomalies using the DetectorSchema to another Nano Message socket provided by the fluentout service. This is the NewValueDetector, which needs training data before it can flag anomalies (see the Getting Started tutorial).
Building the image
Docker compose builds the detectmate image using the Dockerfile in the root of the DetectMate repository. This image is the same for parser, detector and detector-rule.
Volumes
All DetectMate containers (parser, detector and detector-rule) need the following volumes mounted:
-
container/config:/configprovides the DetectMate configuration. Each DetectMate Service needs one settings file for the general service configuration and one config file for the DetectMate component-specific parameters. Fordetectorthese files aredetector_settings.yamlanddetector_config.yamlrespectively. -
container/logs:/logsexposes all log files that are generated by DetectMate services. Mostly needed for debugging. -
container/run:/runis mounted to hold the socket files for inter process communication.parseranddetectorcommunicate via the fileipc:///run/detector.ipcanddetectorandfluentoutuse the socketipc:///run/output.ipc. -
container/state:/statepersists the valuesNewValueDetectorhas learned during training, so it survives container restarts.
Ports
The detector service exposes port 8002 (internally the service runs on port 8000). The management API server runs on this port. This service exposes metrics for the prometheus service and allows to start, stop and reconfigure the service.
Depends
This service depends on the fluentout service, because fluentout creates the socket file to establish communication.
Detector (Rule-Based)
The detector-rule service is a second detector that listens for the same parsed logs as detector, on its own socket. It runs the RuleDetector, which evaluates a fixed list of simple rules (e.g. "the parser found no matching template", "the log text contains a keyword like 'error'") against every log line instead of learning from training data. See the Getting Started tutorial for a walkthrough that triggers one of its rules.
Building the image
Docker compose builds the detectmate image using the same Dockerfile used for parser and detector.
Volumes
-
container/config:/configprovidesdetector_rule_settings.yamlanddetector_rule_config.yaml. -
container/logs:/logsexposes all log files that are generated by DetectMate services. Mostly needed for debugging. -
container/run:/runis mounted to hold the socket files for inter process communication.parseranddetector-rulecommunicate viaipc:///run/detector-rule.ipc, anddetector-ruleandfluentoutuseipc:///run/output-rule.ipc.
Unlike detector, detector-rule does not mount container/state, since the rule-based detector doesn't persist any learned state.
Ports
The detector-rule service exposes port 8003 (internally the service runs on port 8000).
Depends
This service depends on the fluentout service, because fluentout creates the socket file to establish communication.
Fluentout
The fluentoutservice receives data from both detector and detector-rule, parses it from the proper detectmate protobuf format, and then writes the alerts to the logfiles output.%Y%m%d and output-rule.%Y%m%d respectively.
While writing to a log file is just an example in this setup, you can refer to the Fluentd documentation for guidance on writing alerts to other targets.
Since each detector's output socket is a 1:1 Nano Message Pair0 connection, fluentout needs one <source>/<match> pair per detector rather than a single shared one - but both live in the same Fluentd process and container, so no second fluentout container is needed.
Building the image
Docker Compose builds the fluentout image using the configuration in the file container/Dockerfile_fluentd. This Dockerfile uses the official Fluentd image for the base and adds the necessary Fluentd plugins.
Volumes
fluentout mounts the following volumes using bind-mount.
-
container/fluentin:/fluentd/etcprovides the fluentd configuration. The file container/fluentin/fluent.conf contains one<source>/<match>pair fordetector(ipc:///run/output.ipc→output.%Y%m%d) and one fordetector-rule(ipc:///run/output-rule.ipc→output-rule.%Y%m%d), and can be used to reconfigure fluentd to write to other targets. -
container/fluentlogs:/fluentd/logexposes the directory containing written log files. By default,fluentoutwrites alerts fromdetectortooutput.%Y%m%dand alerts fromdetector-ruletooutput-rule.%Y%m%d. -
container/run:/runis mounted to hold the socket files for inter process communication.fluentouttalks todetectorviaipc:///run/output.ipcand todetector-ruleviaipc:///run/output-rule.ipc, both using Nano Message Next Generation via unix domain sockets for maximum performance.
Prometheus
Prometheus is the monitoring server that collects performance metrics from the management api that runs on the parser, detector and detector-rule on port 8000.
Volumes
prometheus mounts the following volumes:
-
container/prometheus.yml:/etc/prometheus/prometheus.ymlis the single prometheus configuration file, that tells prometheus to collect the metrics data fromparser,detectoranddetector-ruleat port 8000*. -
prometheus_data:/prometheusholds the prometheus database.
Ports
This service exposes port 9090
Grafana
Grafana allows to visualize the metrics data that is stored in the prometheus service. Per default the username and password are admin/admin.
Volumes
grafana mounts the following volumes:
container/grafana/prometheus.yml:/etc/grafana/provisioning/datasources/prometheus.ymlis the config file that preconfigures grafana to use prometheus as a datasource.grafana_data:/var/lib/grafanais the database of grafana
Kafka
The Apache Kafka service is a message queue that can be used to read logdata from or send alerts to. It is not needed by the logpipeline and is therefore not active(commented out).
Note
In container/fluentout/fluent.conf contains an example Fluentd configuration for sending alerts to Kafka.